¶ Backend Server Diagnostics
Once you have created your VPN connection in the Backend Servers section of the portal, a suite of diagnostic tools are available for you to troubleshoot any connectivity problems you may be experiencing.
To begin, navigate to the Backend Servers section, then click the blue Actions button, and select Diagnostics.
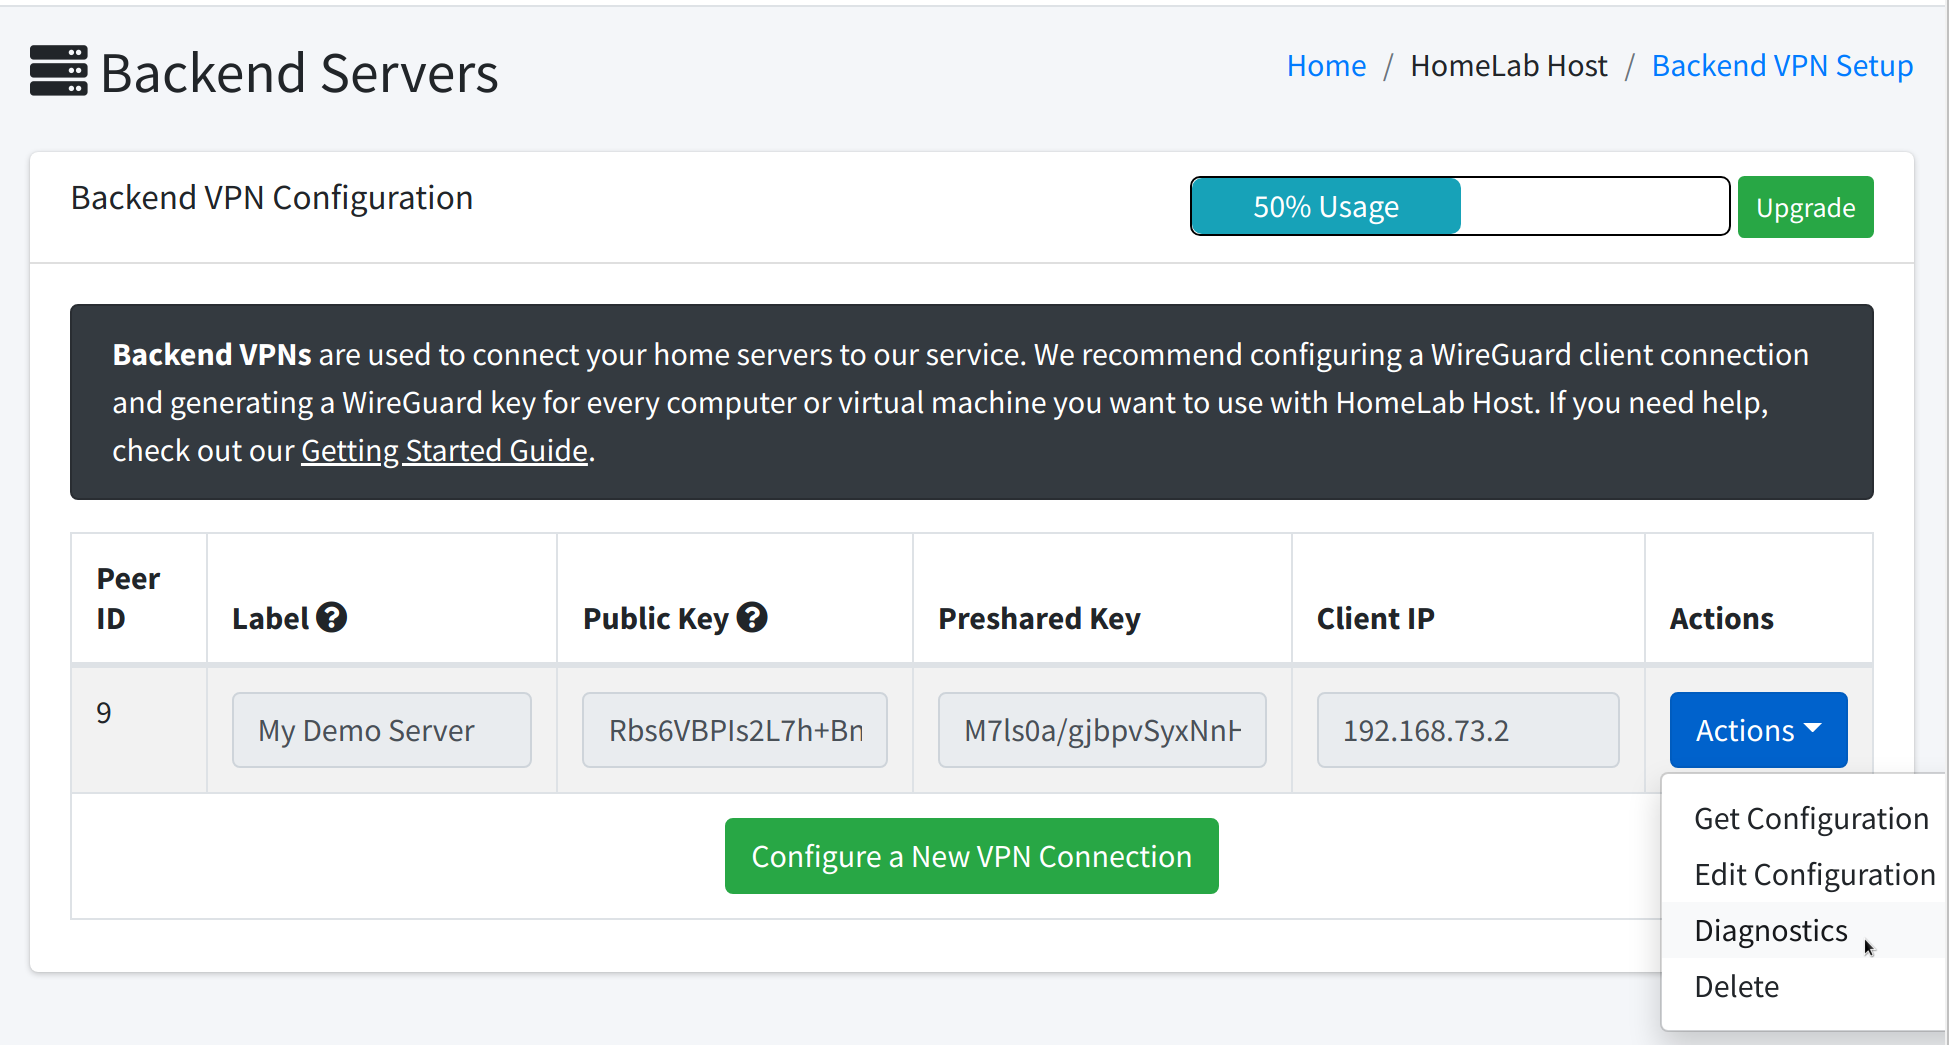
This will take you to the diagnostic tools for this particular VPN connection, which will look like this:
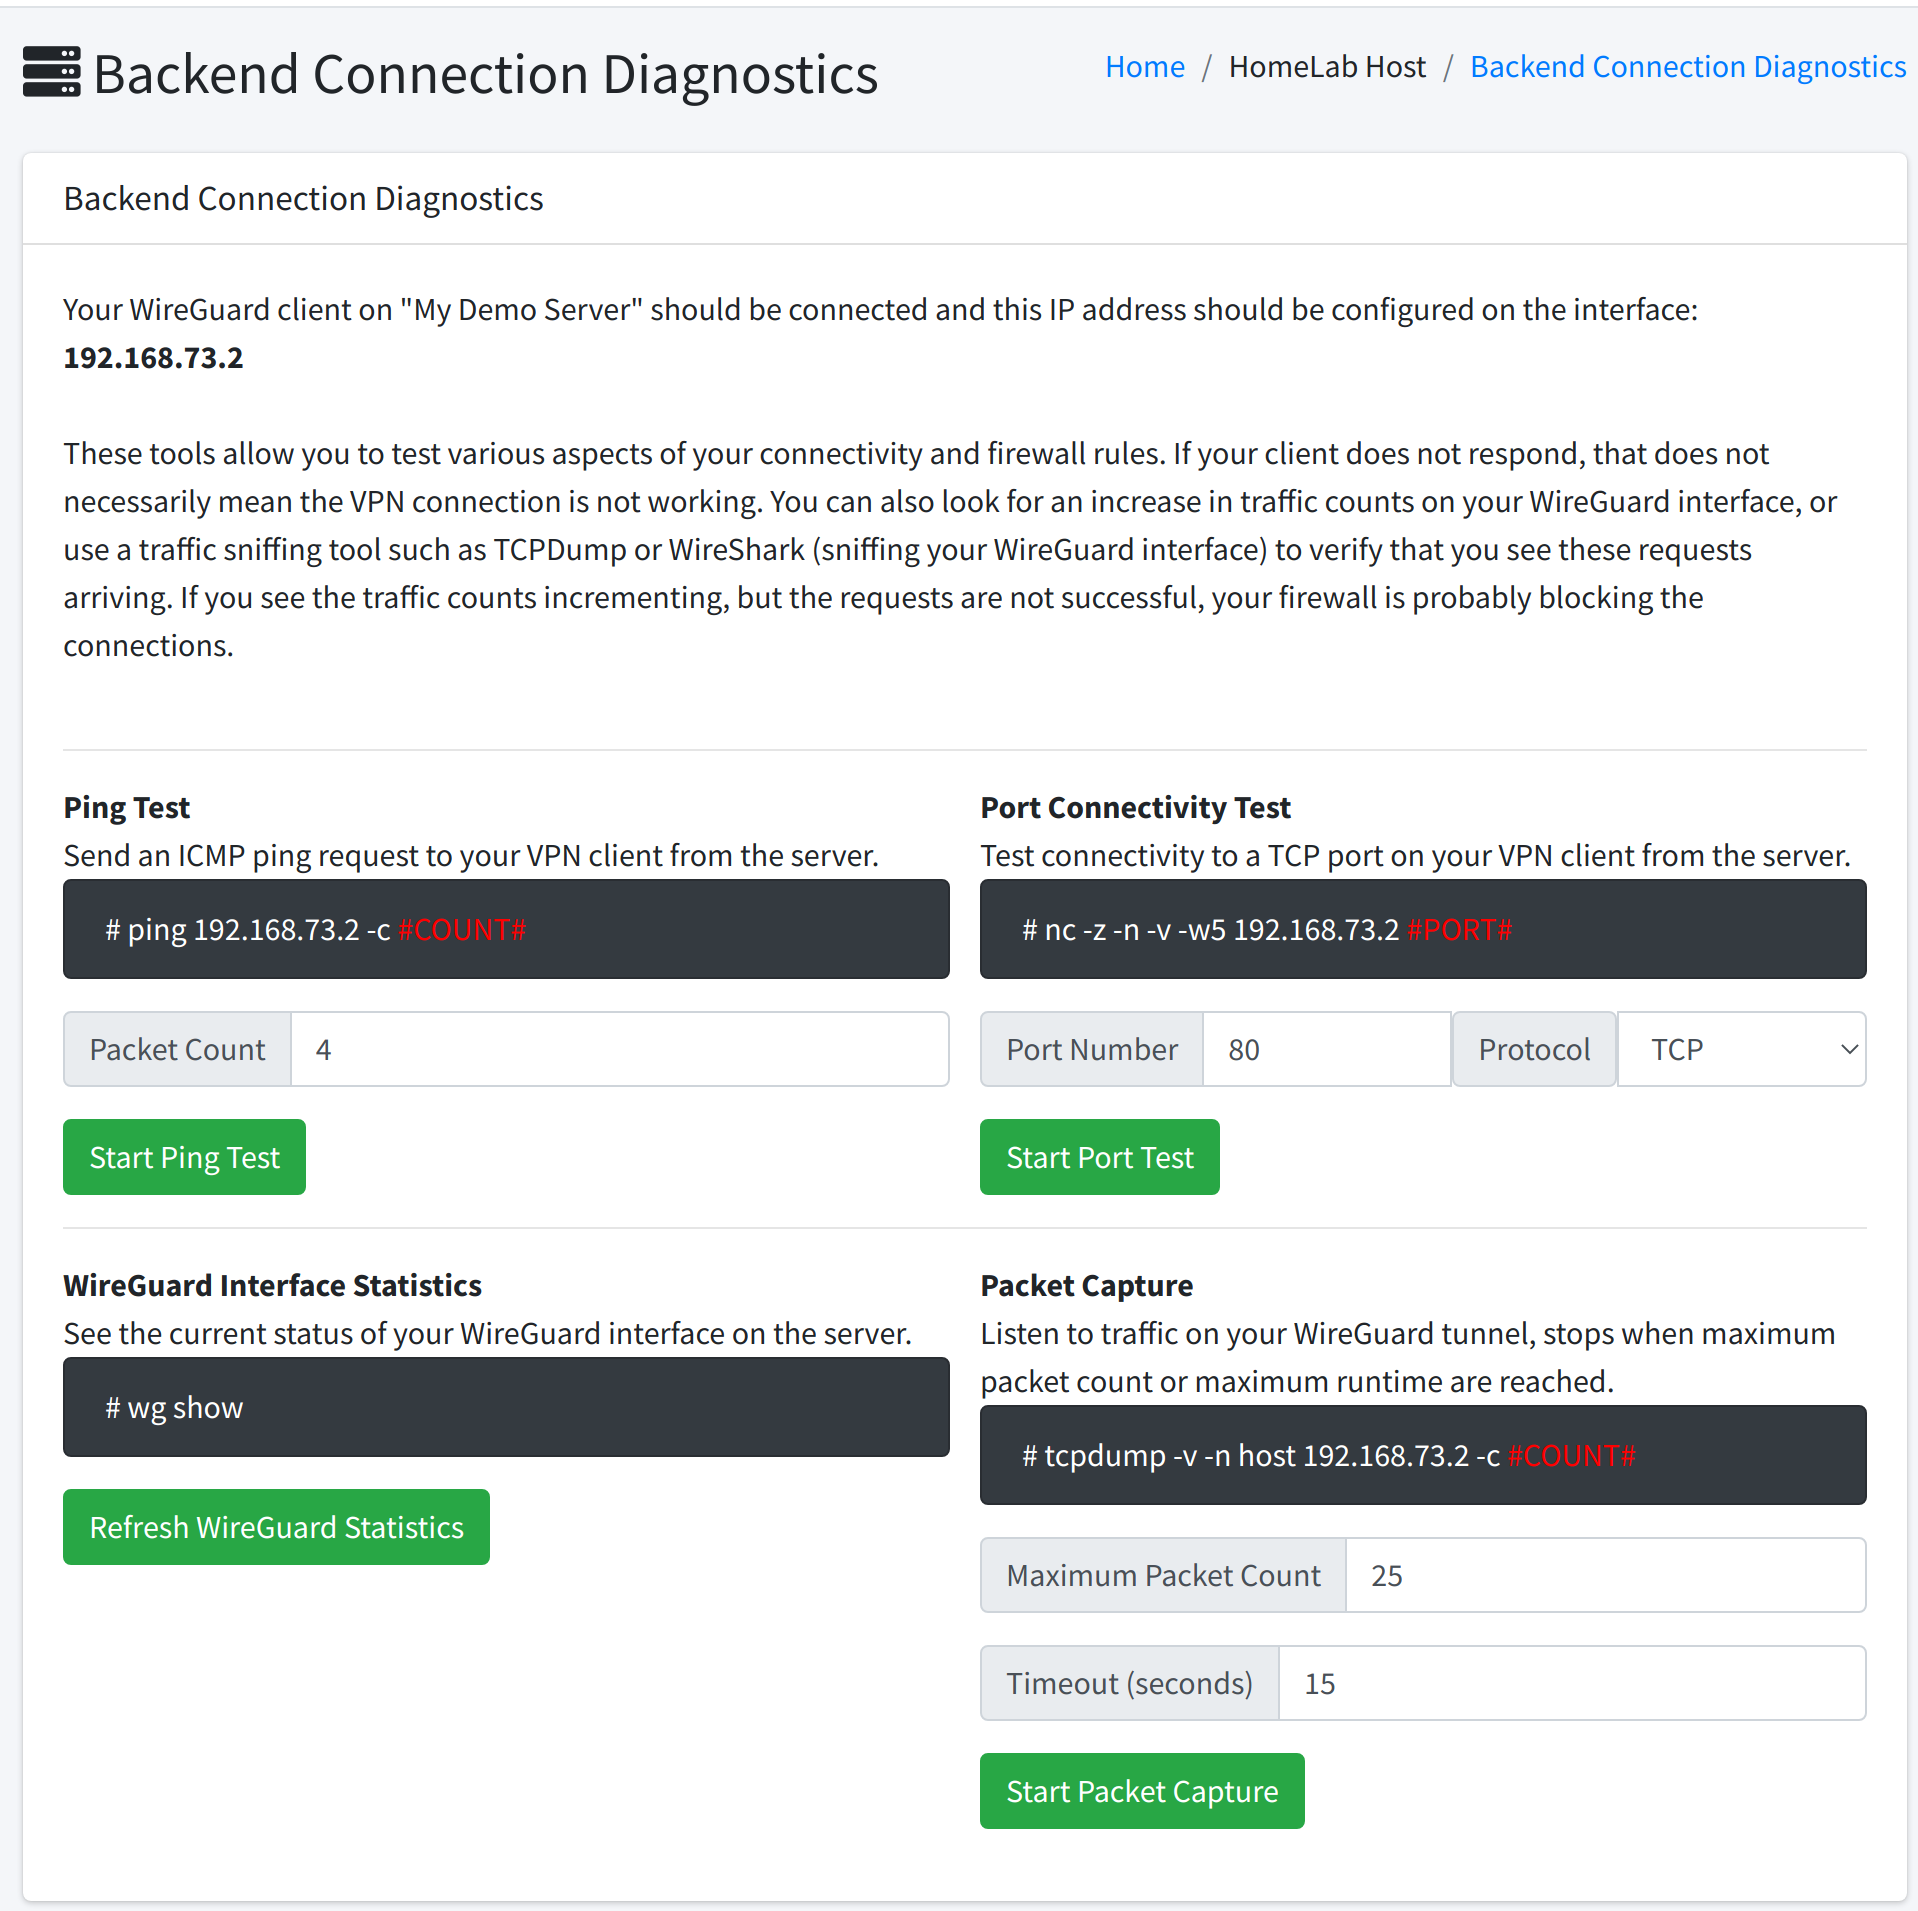
¶ Ping Test
The ping test will run a ping command on our server and send ICMP echo packets to your VPN client IP. The output of the ping result will be displayed.
¶ Options
Packet Count: Set the number of packets you want to send. Increasing the count will make the ping run for a longer amount of time and will collect more packets.
¶ Sample Output
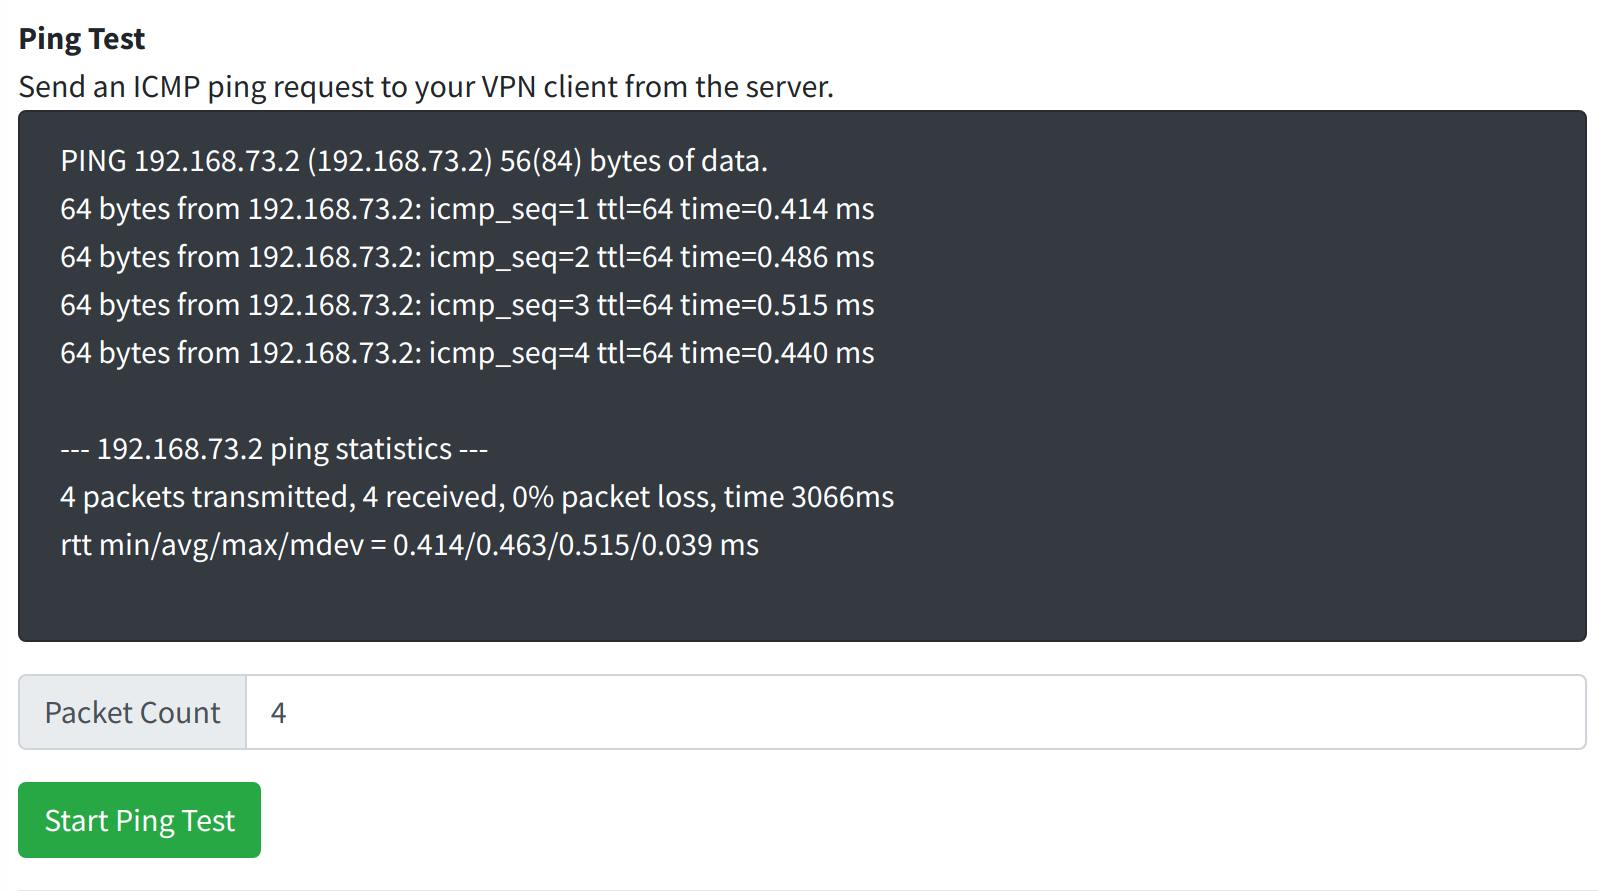
A successful ping test will show you ping responses from your VPN client and the latency of each response.
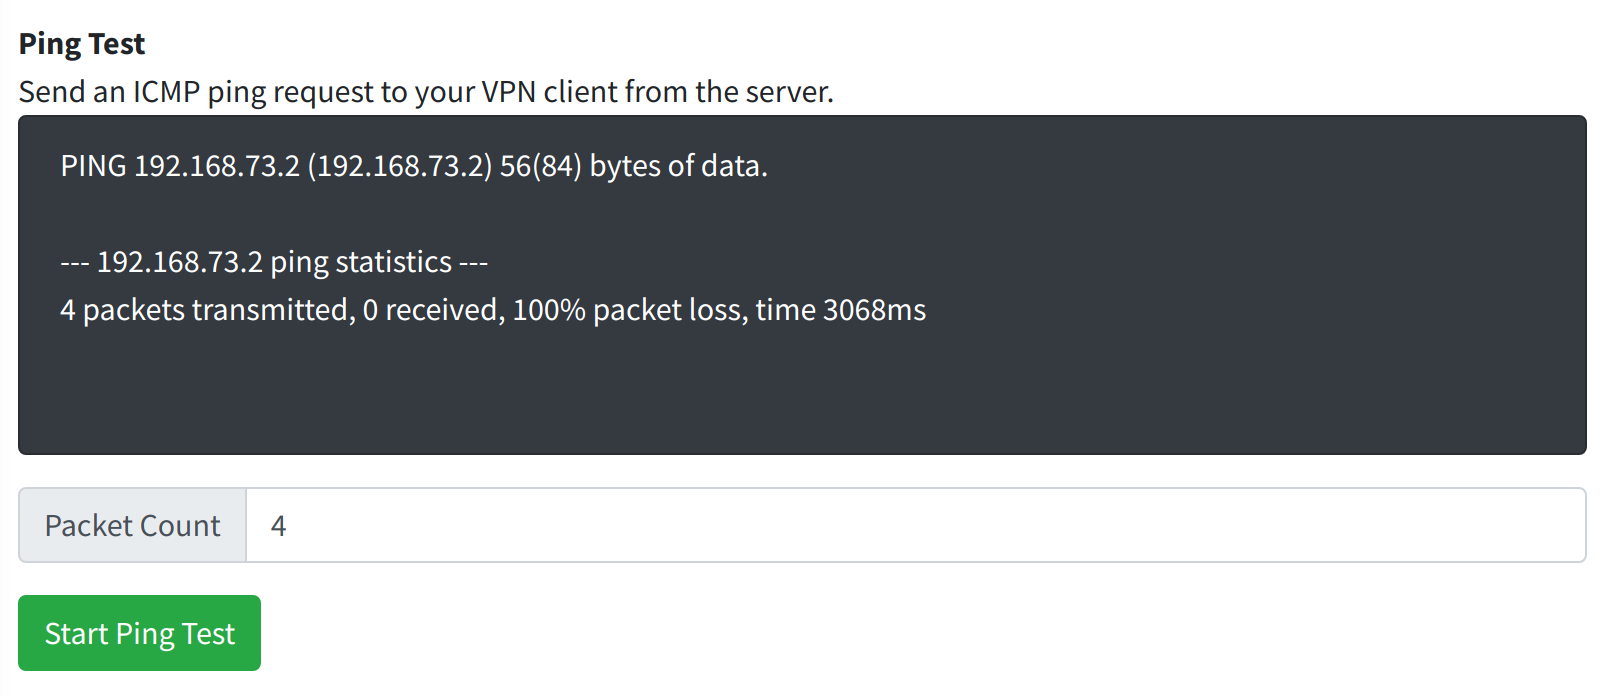
A failed ping test may remain blank on the page for a few moments, then output a summary showing 100% packet loss.
¶ Further Troubleshooting
If you experince a failed ping test with 100% packet loss, you may wish to check:
- Is your home server running and connected to the Internet?
- Is the WireGuard interface running on the server and successfully connected?
- Are firewall rules on your server blocking the ICMP request?
¶ Port Connectivity Test
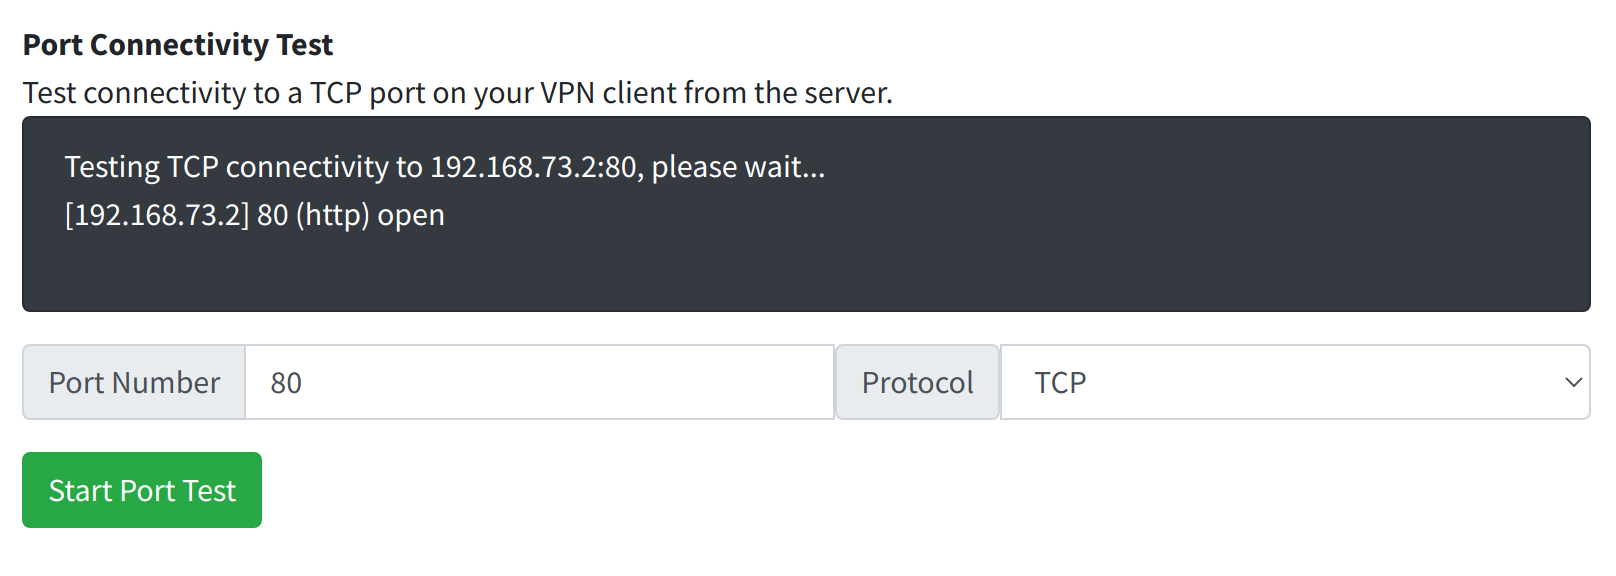
The port connectivity test will use the nc command on our server to test TCP or UDP connectivity to your VPN client IP. The output of the nc command will be displayed.
¶ Options
Port Number: Enter the port number you want to test (like 80 for HTTP, 443 for HTTPS, or any other port).
Protocol: Select TCP or UDP, whichever protocol you are trying to test connectivity on.
¶ Sample Output
Here is an example with a web server running on port 80 (TCP) on the VPN client, we see that the port is open and responds.
If we stop the web server on the VPN client, then test again, we can see what happens when the port is not responding.
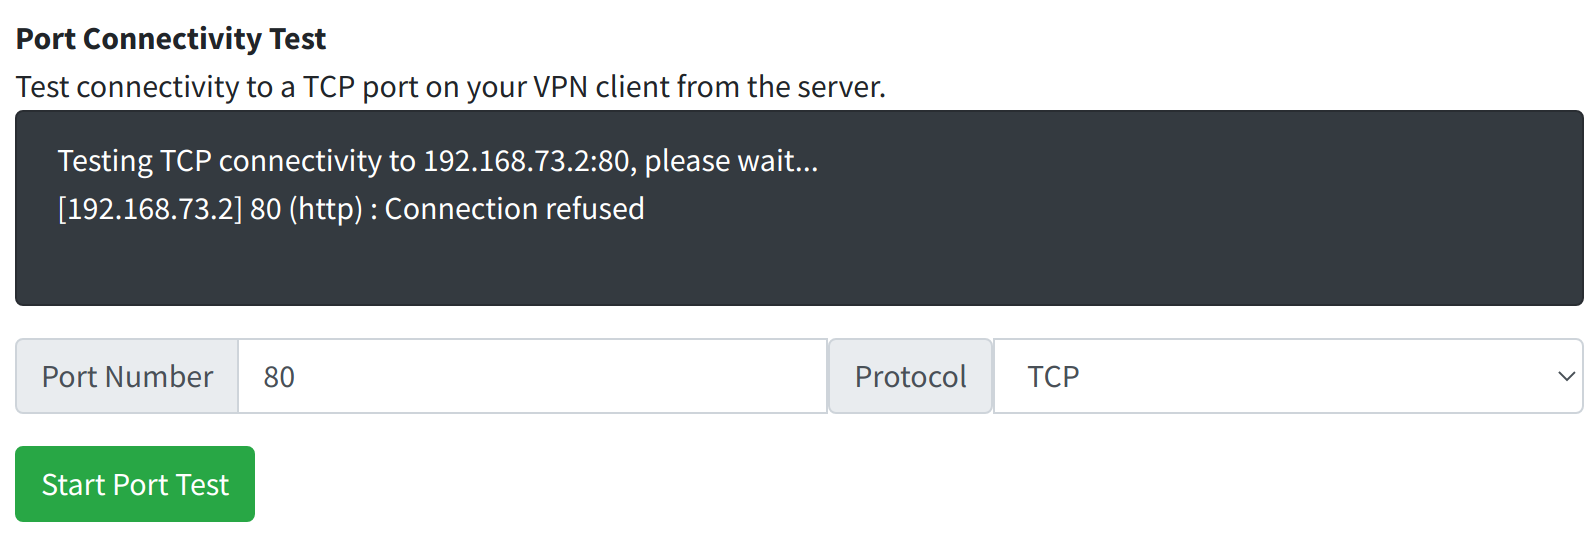
In this case, the VPN is connected but port 80 is closed on the VPN client computer.
¶ Further Troubleshooting
If you experince a failed port test, you may check:
- Use a ping test to make sure that your VPN client is connected and responding.
- Is the service you're testing actively running on the VPN client computer, and is it really listening on the port you think it is? You can review all listening ports on any Linux server by running
ss -ltnp. - Are firewall rules on your server blocking the incoming connection to the port?
¶ WireGuard Interface Statistics
Te WireGuard Connectivity Statistics will use a wg show command on the server to show you the current state of your WireGuard interface. This can be useful for determining the connectivity status if you aren't sure if your tunnel is connected or not.
¶ Sample Output
You will see output similar to running wg show on your client computer.
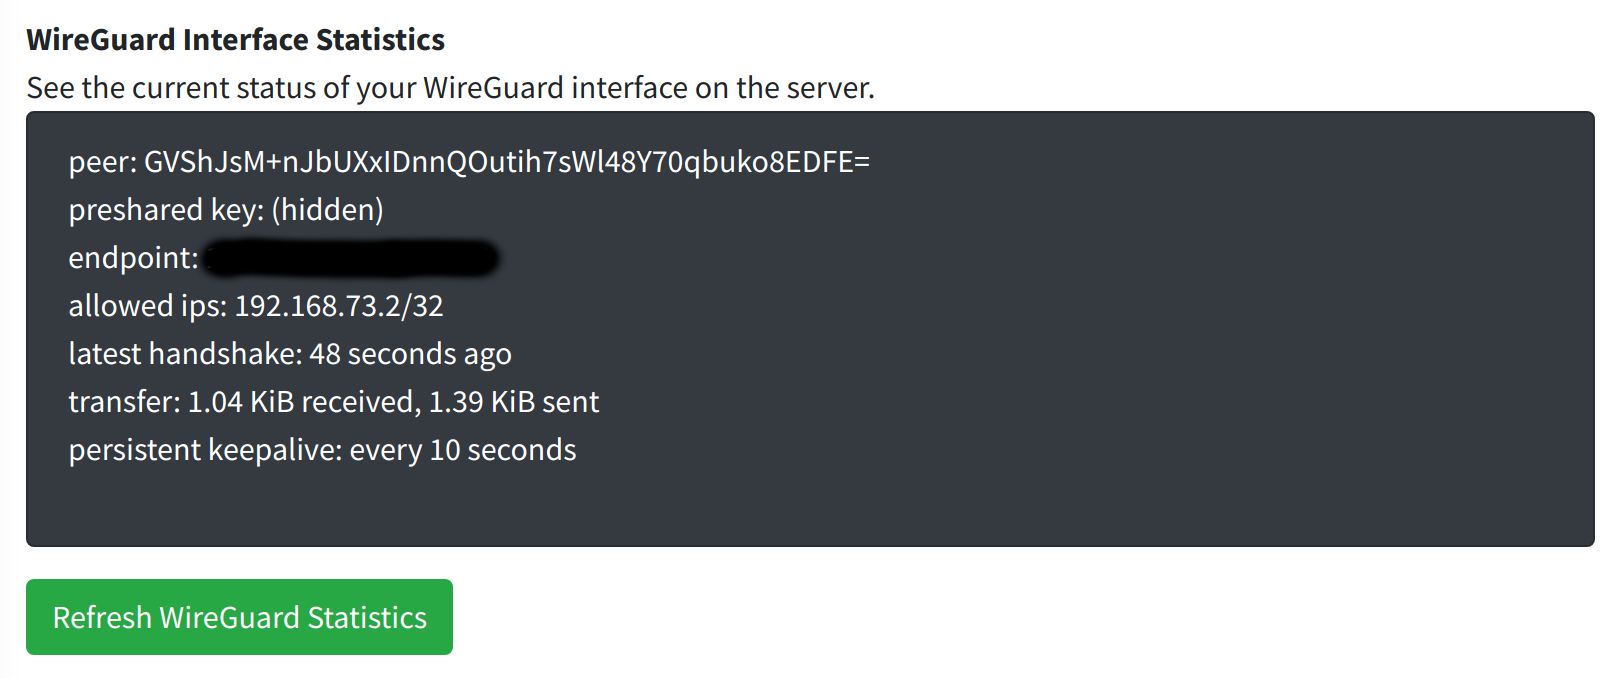
Some information here can be quite useful in troubleshooting. For example, the "endpoint" should show the public IP address of your house. If it is blank, then your VPN may be disconnected.
The 'last handshake' is an intermittent process and so it is normal to see some buildup of time between handshakes, but if the last handshake was a very long time ago (more than a few minutes) it could indicate that your WireGuard client is disconnected.
WireGuard is a stateless VPN protocol, so this can make troubleshooting difficult, there are no logs to help. Therefore, being able to see this information in real time from the server allows you to compare it with your client and debug issues.
¶ Packet Capture
The Packet Capture tool will run a tcpdump command on our server and show you incoming and outgoing data packets between the server and your VPN client.
This can be useful for advanced troubleshooting, but due to its potential to generate a large amount of output, the number of packets to capture is quite limited by default.
¶ Options
Maximum Packet Count: A maximum number of packets to capture and display when running this diagnostic. Increase this to capture more packets in a single run.
Timeout: Number of seconds after which the packet capture will stop, even if the maximum packet count is not reached.
¶ Sample Output
In this example, we begin a packet capture and then on the VPN client we start pinging the WireGuard gateway. (The client is 192.168.73.2, the gateway is 192.168.73.1). We can see both directions of the ICMP requests.
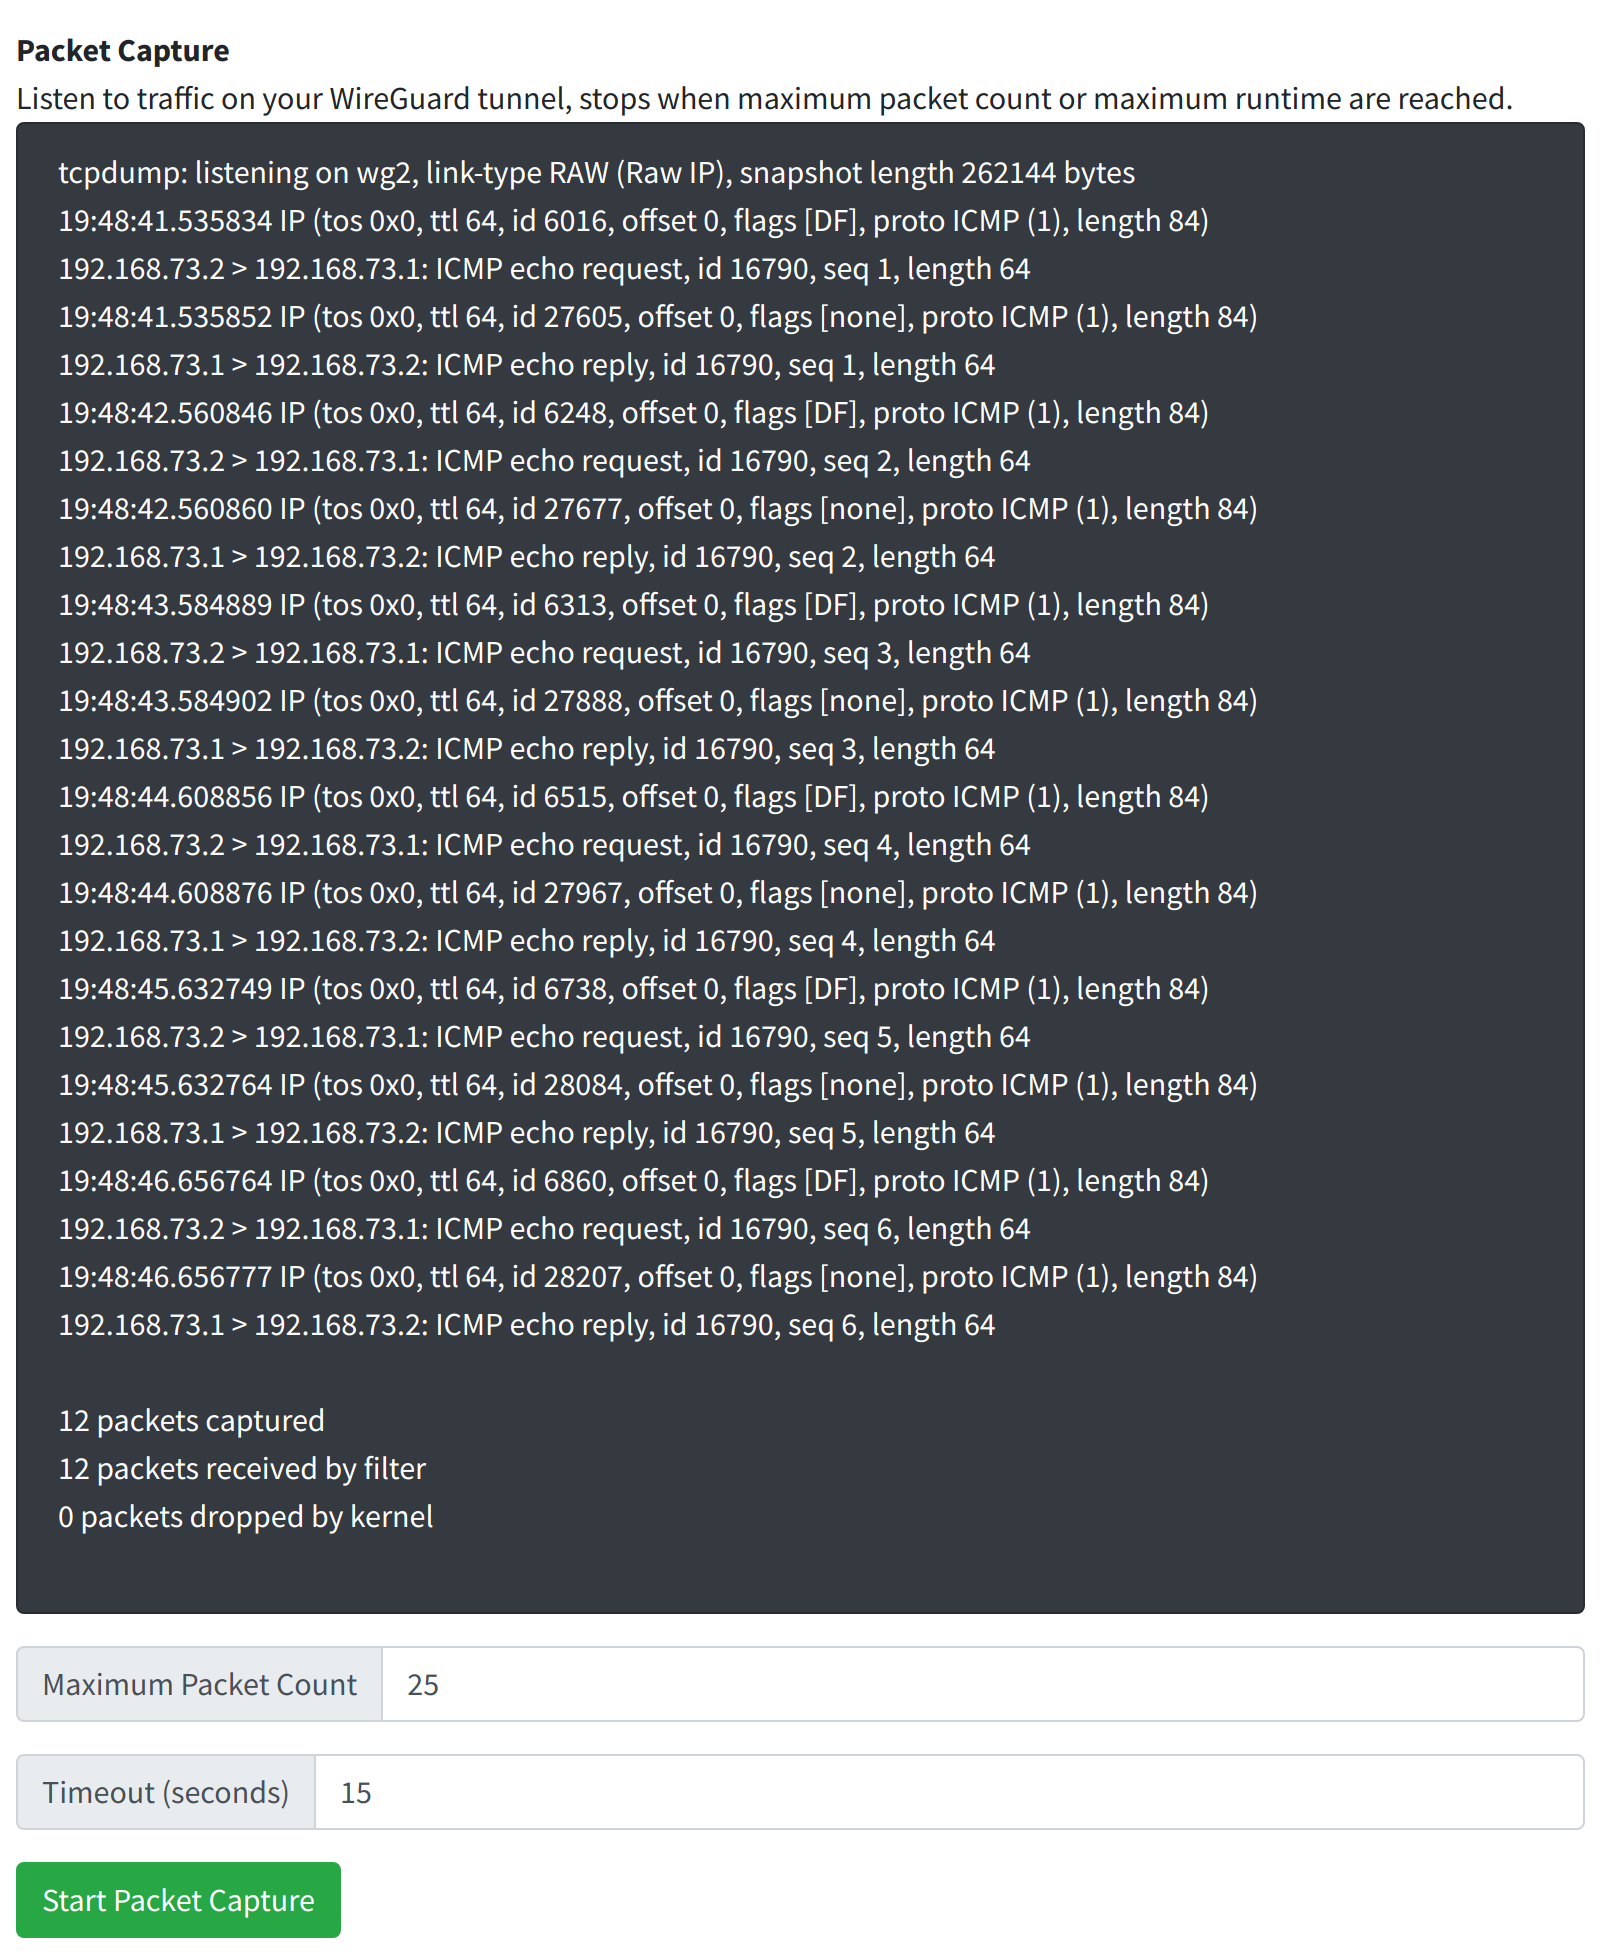
If you are generating other kinds of traffic (like HTTP, HTTPS) you will see these raw packets captured here as well.